Moderne Physik mit Maple
PDF-Buch Moderne Physik mit Maple
Update auf Maple 10
Kapitel 5.2.4
Worksheet hydrogen_10.mws
c ITP Bonn 1995 filename: hydrogen.ms
Autor: Komma Datum: 31.12.93
Korrigierte und ergänzte Fassung 10.02.04
Index: H-Orbitale, zugeordnete Legendre-Polynome, verallgem. Laguerre-Polynome
Thema: Darstellung der Wahrscheinlichkeitsdichten des H-Elektrons
Synopsis: 3d-Darstellung und Polarplot der Kugelfunktionen, Plot der Radialfunktion,
Wahrscheinlichkeitsdichte als Funktion von r und theta (3d- und contour-Plot).
Demonstration zur Verwendung von Prozeduren und Funktionen.
H-Orbitals
| > | restart: |
With(orthopoly) macht das package bekannt, in dem die Legendre-Polynome P(l,x) zu finden sind.
| > | with(plots): #with(orthopoly); |
| > | #P(5,x);#test |
| > | #diff(P(5,x),x$2); # test |
| > |
Man kann P(l,x) aber auch leicht selbst definieren:
| > | P:=(l,x)->if l<>0 then 1/(2^l*l!)*diff((x^2-1)^l,x$l) |
| > | else 1 fi; |

| > | P(5,x); #test # expand(%); |

| > | expand(%); |

| > |
Dann schreibt man eine kleine Prozedur für die zugeordneten Legendre-Polynome:
| > | Y:=proc(l,m,x) ; |
| > | if m=0 then P(l,x) else |
| > | (1-x^2)^(m/2)*diff(P(l,x),x$m) |
| > | fi; |
| > | end; |
![]()
| > |
Test
| > | Y(5,0,u); |

| > | expand(%); |

| > |
Für die Plots sollte man x durch cos(theta) ersetzen. Diese Konstruktion ist einfacher, als von vornherein mit theta zu arbeiten (wegen der Ableitungen). Man benötigt aber eine dummy-Variable (ebenfalls wegen diff).
| > | ply:=dummy->subs(dummy=cos(theta),Y(l,m,dummy)); |
![]()
| > | l:=2:m:=0: |
| > | ply(poo); |

Normierung
| > | l:='l' : m:='m': |
| > | Ny2:=(2*l+1)*(l-m)!/(l+m)!; #Normierung^2*4*Pi |

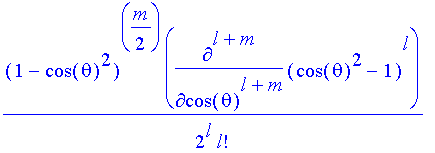
Y(l,m,x);
Kontrolle der "spherical harmonics" nach Vorgabe von l und m:
| > | l:=3:m:=2:Y(l,m,x);ply(o); |
![]()
![]()
| > |
| > | n:='n';l:='l';m:='m'; |
![]()
![]()
![]()
| > | Ny2*ply(o)^2; |

| > |
| > |
Nun kann man sich das Quadrat der Kugelfunktion zeigen lassen:
| > | l:=3:m:=1: sphereplot(Ny2*ply(o)^2,phi=Pi/2..2*Pi,theta=0..Pi,axes=boxed,scaling=constrained,grid=[15,100]); |
![[Maple Plot]](hydrogen/hydrogen_1016.gif)
| > |
Das ist schon ein ganz brauchbares Maß für die Winkelabhängigkeit der Aufenthaltswahrscheinlichkeit eines Elektrons.
Nicht ganz so schön, aber informativ:
| > | polarplot(Ny2*ply(o)^2,theta=0..2*Pi,scaling=constrained); |
![[Maple Plot]](hydrogen/hydrogen_1017.gif)
| > |
um Pi/2 gedreht zum Vergleich mit der 3d-Darstellung
(und zur Demonstration eines parametrischen Aufrufes):
| > | polarplot([Ny2*ply(o)^2,theta+Pi/2,theta=0..2*Pi],scaling=constrained); |
![[Maple Plot]](hydrogen/hydrogen_1018.gif)
| > | l:='l': m:='m': n:='n': |
Nun die Radialfunktion:
Man benötigt die verallgemeinerten Laguerre-Polynome die im orthopoly-package stehen.
Wer dieses package nicht hat, schreibt:
| > | #u=2*r/(a*n) |
| > | a:='a': # (Bohrscher Radius =1, wird ggf. weiter unten benoetigt) |
| > | l:='l': m:='m': n:='n': L:=(j,k,u)->if j<>0 then 1/j!*exp(u)/u^k*diff(u^(j+k)*exp(-u),u$j) |
| > | else 1 fi; |

| > |
Radialfunktion(u):
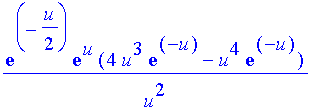
| > | Ru:=(n,l,u)->u^l*exp(-u/2)*L(n-l-1,2*l+1,u); |

Test (l <= n-1) ... bitte genau hinschauen: l = el, 1 = eins ... oder andere Namen oder Schrifttypen wählen
| > | n:=3:l:=1: |
| > | Ru(n,l,u); |

Radialfunktion(r) und Normierung
| > | n:='n':l:='l':r:='r': |
| > | plr:=u->subs(u=2*r/(n*a),simplify(Ru(n,l,u))); |

| > | Nr2:=4*(n-l-1)!/(n+l)!/(a^3*n^4); #Normierung^2 |

| > | n:=3:l:=1: |
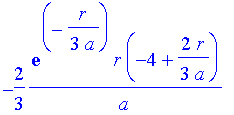
| > | plr(etwas); |

| > |
| > |
Für die Wahrscheinlichkeitsdichte muß die Radialfunktion plr = R(n,l,r) noch mit r multipliziert
werden, dann kann man sich wieder das Quadrat zeigen lassen:
| > | a:=1: |
| > | plot(Nr2*(r*plr(o))^2,r=0..30); |
![[Maple Plot]](hydrogen/hydrogen_1025.gif)
Weitere Tests
| > | l:=0: |
| > | Nr2*(r*plr(o))^2; |

| > | n:='n';Nr2*(r*plr(o))^2; |
![]()

| > | plot([seq(Nr2*(r*plr(o))^2,n=1..3)],r=0..30,color=[red,green,blue]); |
![[Maple Plot]](hydrogen/hydrogen_1029.gif)
Test der Normierung
| > | seq(int(Nr2*(r*plr(o))^2,r=0..infinity),n=1..3); |
![]()
| > | l:=1: |
| > | plot([seq(Nr2*(r*plr(o))^2,n=2..3)],r=0..30,color=[red,green,blue]); |
![[Maple Plot]](hydrogen/hydrogen_1031.gif)
| > | seq(int(Nr2*(r*plr(o))^2,r=0..infinity),n=2..3); |
![]()
| > |
| > |
| > |
Will man noch die Winkelabhängikeit sehen, so stellt man das Produkt (r*R*Y)^2 am besten
dreidimensional und in Polarkoordinaten dar (mit der richtigen nlm-Kombination).
| > | n:='n': l:='l':m:='m': |
| > | plr(o);ply(o); |


| > |
| > | Nr2*Ny2*(r*plr(etwas)*ply(o))^2; |


| > |
| > |
| > | n:=3:l:=2:m:=1: |
| > | Nr2*Ny2*(r*plr(etwas)*ply(o))^2; |

| > | plot3d([r*cos(theta),r*sin(theta),Nr2*Ny2*(r*plr(etwas)*ply(o))^2], |
| > | r=0..30,theta=Pi/2..2*Pi,axes=boxed); |
![[Maple Plot]](hydrogen/hydrogen_1038.gif)
| > |
Nach der Ausführung des obigen Befehls kann man mit der linken Maustaste die box angeklickt halten und so ziehen, daß man das Bild von oben betrachtet. Der Plot wird nach Betätigen der rechten Maustaste neu aufgebaut. Man wähle dann style=contour!
Oder automatisiert:
| > | plot3d([r*cos(theta),r*sin(theta),Nr2*Ny2*(r*plr(o)*ply(o))^2], |
| > | r=0..20,theta=0..2*Pi,axes=boxed,orientation=[0,0], |
| > | shading=z,style=patchcontour,scaling=constrained); |
![[Maple Plot]](hydrogen/hydrogen_1039.gif)
| > |
Mit Titel und ohne Achsen
| > | txt:=`nlm=`||n||l||m: |
| > | txt; |
![]()
| > |
| > | plot3d([r*cos(theta),r*sin(theta),Nr2*Ny2*(r*plr(o)*ply(o))^2], r=0..20,theta=0..2*Pi,orientation=[0,0],style=patchcontour,scaling=constrained,shading=z,title=`txt`); |
![[Maple Plot]](hydrogen/hydrogen_1041.gif)
| > |
Und weil das so schön ist, macht man eine procedur daraus:
| > | myhydrogenplots:=proc(n,l,m) global a,p1,p2,p3,p4,p5; local txt; |
| > | a:=1; |
| > | #print(Y(l,m,x)); |
| > | #print(ply(o)); |
| > | txt:=`nlm=`||n||l||m: |
| > | p1:=sphereplot(Ny2*ply(o)^2,phi=Pi/2..2*Pi,theta=0..Pi,axes=boxed,scaling=constrained,grid=[15,100],title=`txt`); |
| > | print(p1); |
| > | p2:=polarplot([Ny2*ply(o)^2,theta+Pi/2,theta=0..2*Pi],scaling=constrained,title=`txt`); |
| > | print(p2); |
| > | p3:=plot(Nr2*(r*plr(o))^2,r=0..30,title=`txt`); |
| > | print(p3); |
| > | p4:=plot3d([r*cos(theta),r*sin(theta),Nr2*Ny2*(r*plr(o)*ply(o))^2], |
| > | r=0..30,theta=Pi/2..2*Pi,axes=boxed,title=`txt`); |
| > | print(p4); |
| > | p5:=plot3d([r*cos(theta),r*sin(theta),Nr2*Ny2*(r*plr(o)*ply(o))^2], |
| > | r=0..30,theta=0..2*Pi,axes=boxed,orientation=[0,0],style=patchcontour,scaling=constrained, |
| > | shading=z,title=`txt`); |
| > | end; |
![]()
![]()
![]()
![]()
![]()
![]()
![]()
![]()
![]()
![]()
![]()
![]()
![]()
![]()
![]()
![]()
| > |
Bitte warten, bis alle fünf Plots erschienen sind.
| > | myhydrogenplots(4,3,0); |
![[Maple Plot]](hydrogen/hydrogen_1058.gif)
![[Maple Plot]](hydrogen/hydrogen_1059.gif)
![[Maple Plot]](hydrogen/hydrogen_1060.gif)
![[Maple Plot]](hydrogen/hydrogen_1061.gif)
![[Maple Plot]](hydrogen/hydrogen_1062.gif)
| > |
In der Prozedur wurden die Plots unter Namen abgespeichert und können nun weiter verwendet werden, wenn man z.B. die Optionen ändern will.
| > | display(p1,style=wireframe,shading=z,orientation=[56,70]); |
![[Maple Plot]](hydrogen/hydrogen_1063.gif)
| > |
Es lohnt sich aber auch das Abspeichern der Plots in .m-files, man kann sich so eine schnell abrufbare Sammlung von "Orbitals" zulegen.
| > |
| > | for n from 4 to 4 do |
| > | for l from 0 to n-1 do |
| > | for m from 0 to l do |
| > | txt:=`nlm=`||n||l||m: |
| > | #print(polarplot([Ny2*ply(o)^2,theta+Pi/2,theta=0..2*Pi],scaling=constrained,title=`txt`)); |
| > | p||n||l||m:=plot3d([r*cos(theta),r*sin(theta),Nr2*Ny2*(r*plr(o)*ply(o))^2], |
| > | r=0..50,theta=0..2*Pi,axes=boxed,orientation=[0,0],style=contour,scaling=constrained, |
| > | shading=z,title=`txt`,numpoints=1000); |
| > | print(p||n||l||m); |
| > | od; od; od; |
![[Maple Plot]](hydrogen/hydrogen_1064.gif)
![[Maple Plot]](hydrogen/hydrogen_1065.gif)
![[Maple Plot]](hydrogen/hydrogen_1066.gif)
![[Maple Plot]](hydrogen/hydrogen_1067.gif)
![[Maple Plot]](hydrogen/hydrogen_1068.gif)
![[Maple Plot]](hydrogen/hydrogen_1069.gif)
![[Maple Plot]](hydrogen/hydrogen_1070.gif)
![[Maple Plot]](hydrogen/hydrogen_1071.gif)
![[Maple Plot]](hydrogen/hydrogen_1072.gif)
![[Maple Plot]](hydrogen/hydrogen_1073.gif)
| > |
Abspeichern
| > | #save p4||(0..3)||(0..3),`hydro4.m`; |
| > |
| > | #restart: |
| > | #read `hydro4.m`; |
| > | #anames(); |
| > |
| > | #p411; |
| > |
Das Ergebnis kann von jeder Maple-session aus mit
read `hydro4.m`;
eingelesen werden. Mit anames(); erfährt man die Namen der Plots (allerdings auch alle anderen zugewiesenen Namen der jeweiligen session -- anames(); also möglichst zu Beginn der session verwenden).
| > |
komma@oe.uni-tuebingen.de